
Did you know that the air you breathe deeply influences your well-being? Breathing fresh air outdoors can feel like a distant dream due to the limited control over exposure to air pollutants. However, you can still create a comfortable indoor environment that supports better productivity and satisfaction with proper air quality. Consider an IoT based Indoor Air Quality ENS160 Monitor to regulate air quality in your home.
Keeping your home dust-free or air-conditioned does not guarantee clean air. These air filtration practices are only effective against larger particles like dust, pollen, and pet dander, but fail to remove finer particles and pollutants. To access cleaner air indoors, you need to be aware of the state of the air, the presence of harmful substances emitted from everyday products and Carbon Dioxide concentration (by-product of combustion and human respiration). All of these factors can be quantified using standardised air quality metrics. Have a look for a better understanding:-
Air Quality Metrics
Factors | AQI (Air Quality Index) | TVOC (Total Volatile Organic Compounds) | ECO2 (Equivalent Carbon Dioxide) |
Defenition | Represents the overall air quality rating on the scale of 1 to 5. | Measure of total VOCs (Volatile Organic Componds) such as ethanol, toluene, hydrogen present in the air in ppb (parts per billion). | Measure of the equivalent CO2 (Carbon Dioxde) concentartion in the air in ppm (parts per million). |
Inference | Helps understand the state of air we breathe. High AQI means you to need take actions like opening windows or using air purifier. | Detects exposure to harmfull substances emitted from everyday products. High TVOC levels means you need to check for sources like paints, cleaners or toxic chemicals and remove/reduce their usage. | Identify areas of poor ventilation and also indicate the potential concentration of airborne viruses in a room. High ECO2 levels can lead to drowsiness and reduced cognitive function. |
IAQ (Indoor Air Quality) Influencers |
|
|
|
Tracking the air quality metrics not only helps you identify the Indoor air contaminants, take actions to remove/reduce their usage and significantly improve the IAQ (Indoor Air Quality). A good IAQ improves your alertness, uplifts your mood and helps you avoid falling ill frequently. Let’s build a DIY easy-to-use IoT-based Indoor Air Quality Monitor with LIVE air quality metrics and temperature tracking using IoT.
Take a look at some of the jargon you might come across in this DIY E-Project:-
- The Gravity Air Quality Sensor, using the new ScioSenses’ ENS160 sensor chip, can detect organic effluents and oxidising gases. It supports intelligent algorithms to process the raw sensor measurements and calculate air quality metrics in terms of AQI (Air Quality Index), TVOC (Total Volatile Organic Compounds), and ECO2 (Equivalent Carbon Dioxide).
- Raspberry Pi Pico W is a low cost, high performance microcontroller developed by Raspberry Pi Foundation. The Raspberry Pi Pico W’s onboard single-band 2.4 GHz wireless interface (802.11n) unlocks its ability to establish a connection with a Wi-Fi router. It also has a built-in temperature sensor to measure the surrounding air temperature. The Raspberry Pi Pico W takes the temperature readings by checking the voltage of a special diode connected to its ADC4 pin internally. This measurement is only an approximation, as the reading can be slightly higher than the room temperature.
- Adafruit.IO developed by Adafruit Industries, is a cloud-based service for hosting IoT (Internet of Things) projects. It enables real-time data exchange between IoT devices and the cloud infrastructure. It has two major parts :
- Feeds are distinct data channels, each identified by a unique identifier and can store various types of data, including sensor readings, status updates, and user inputs.
- Dashboards provide a visual hub for observing and managing IoT devices by showcasing individual feeds’ data collection in real-time. You can also interact with IoT devices with the help of custom widgets or buttons.
Explore the Raspberry Pi Pico/Pico W Related DIY E-Project: Testing Scoppy Pico Smart Oscilloscope with 5 electronic circuits
This is how the IoT based Indoor Air Quality ENS160 Monitor works. When powered on, the Gravity ENS160 Air Quality sensor constantly monitors the air quality in terms of AOI, TVOC, ECO2 and sends these metrics to the Raspberry Pi Pico W via I2C communication. Raspberry Pi Pico W also records the temperature using its built-in sensor. When you switch On the Wi-Fi router and log in to the Adafruit.IO dashboard, Raspberry Pi Pico W establishes a connection with Adafruit.IO via the internet using the setup credentials pre-fed in the programming instructions. Once Raspberry Pi Pico W acknowledges the readings received from the Gravity ENS160 Air Quality sensor and its built-in temperature sensor, these are published to the respective feeds such as TEMP, AQI, TVOC, and ECO2 via MQTT protocol. Thus, the indoor air quality metrics get updated in real-time every few seconds, which can be viewed from your Adafruit.IO dashboard.
This DIY E-Project aims to keep a LIVE track of the air quality metrics readings, such as AQI, TVOC, and ECO2 from the Gravity ENS160 air quality sensor, along with the temperature from Raspberry Pi Pico W’s inbuilt temperature sensor on the Adafruit.IO dashboard via the internet with the help of Raspberry Pi Pico W.
E-COMPONENTS
These are all the electronic components which are required for this DIY E-Project and their purchase links:-
MODEL | E-COMPONENT | PURCHASE LINK |
 | Raspberry Pi Pico W | |
 | Gravity ENS160 Air Quality Sensor | |
 | USB data cable | |
 | Power Bank |
Fun Fact: Two similar Air Quality Sensors, Gravity ENS160 and Fermion ENS160, are available in the market. The only minor difference is that Gravity ENS160 supports the I2C interface, while Fermion ENS160 supports both the I2C and SPI interfaces.
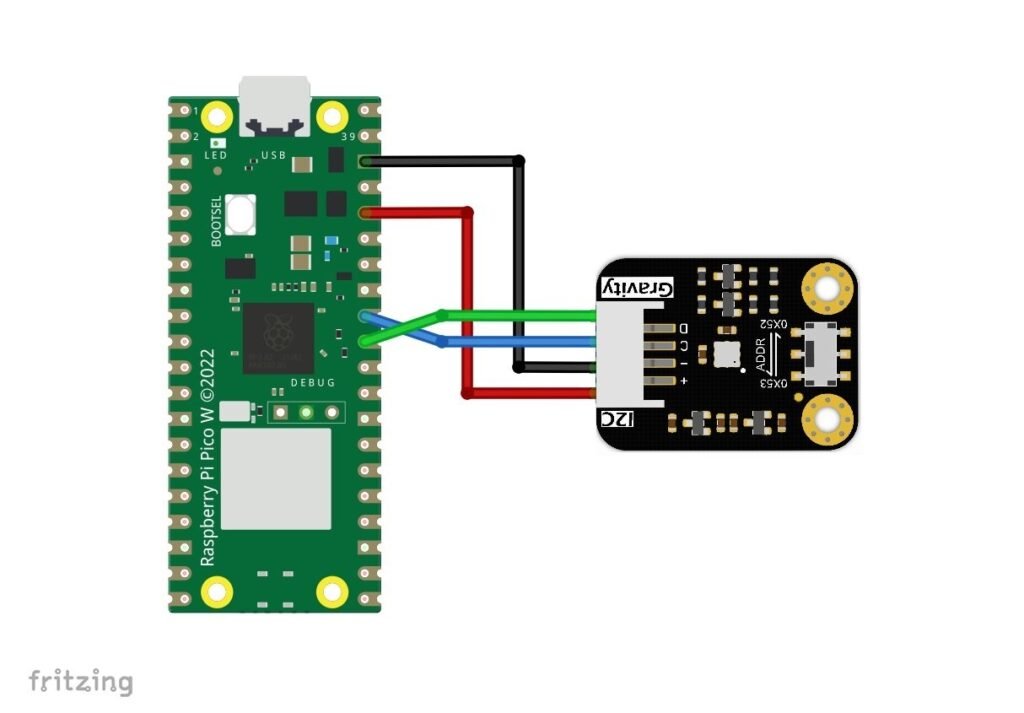
CIRCUIT DIAGRAM
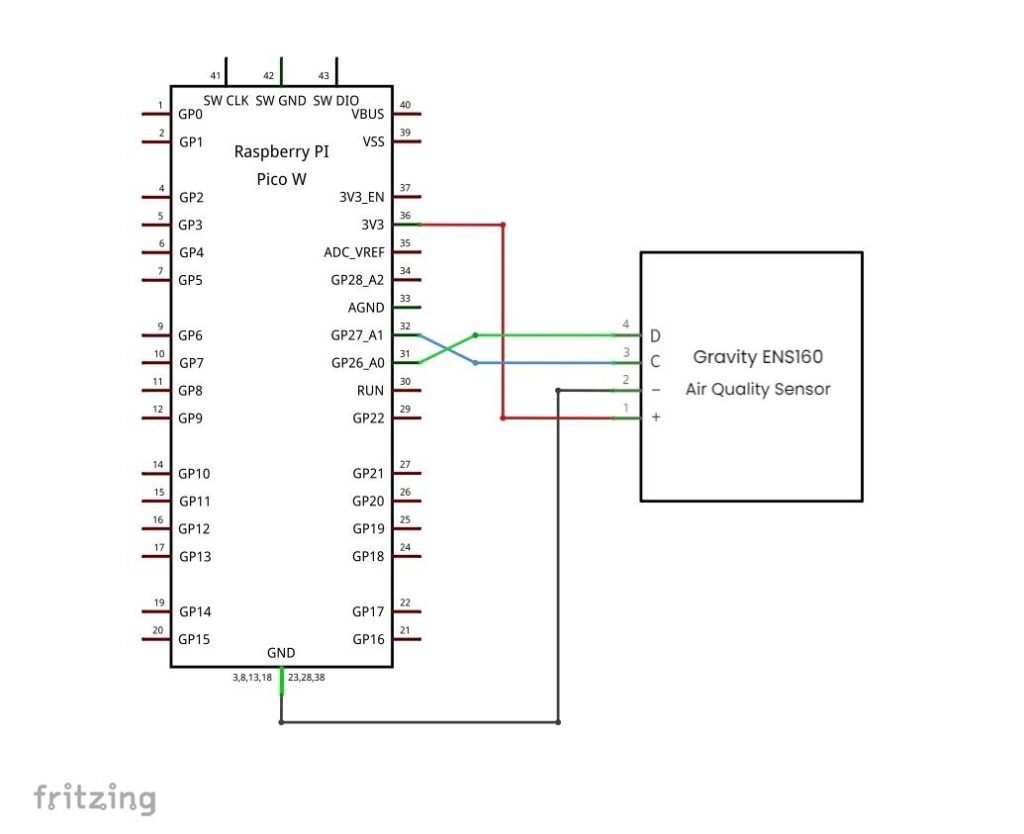
SCHEMATIC DIAGRAM
PROCEDURE
These are some of the step-by-step guidelines to be followed for this DIY E-Project:-
- Setting up the Raspberry Pi Pico W:
- Download the latest MicroPython firmware .uf2 file for the Raspberry Pi Pico W model from www.raspberrypi.com/documentations/micropython/raspberry-pi-pico-w
- Press and hold the “BOOTSEL” button on Raspberry Pi Pico W while simultaneously connecting it to your Laptop/PC via data cable. This will enable Raspberry Pi Pico W to enter Bootloader mode and appear as a mass storage device.
- Release BOOTSEL once the external drive RPI-RP2 appears on your Laptop/PC. Paste the .uf2 firmware (downloaded from step 1) to the external drive RPI-RP2 of Raspberry Pi Pico/Pico W.
- Visit https://thonny.org/ and download and install the latest version of Thonny IDE, depending on your Windows OS architecture, i.e. x64 or x86.
- Launch the Thonny IDE by keeping the Raspberry Pi Pico W connected to your Laptop/PC. Go to →Tools→Options→Interpreter→Select Micro Python (Raspberry Pi Pico) →Select Board CDC @COM Port accordingly from the Port or WebREPL dropdown→click on OK. (Note: the COM port number may be different depending on your Laptop/PC.)
- Installing the dependencies:
- Install the
micropython-umqtt.simplelibrary to establish communication between Raspberry Pi Pico W and Adafruit.IO. However, if you directly install this library from Thonny IDE, you might get an error prompt such as:-ERROR: micropython-umqtt.simple from https://files.pythonhosted.org/packages/bd/cf/697e3418b2f44222b3e848078b1e33ee76aedca9b6c2430ca1b1aec1ce1d/micropython-umqtt.simple-1.3.4.tar.gz does not appear to be a Python project: neither 'setup.py' nor 'pyproject.toml' found. Error: process returned with code 1
A lot of users have reported this issue earlier as well. The problem seems to be that pip (package installer for Python) cannot find the standard Python package files necessary for installing the
micropython-umqtt.simplelibrary. Fix this error with the next step. - Download the ”
micropython-umqtt.simplefolder” from micropython-umqtt.simple · PyPI. Extract theumqttsubfolder frommicropython-umqtt.simplefolder and save it on your Laptop/PC. Open Thonny IDE→View→✔Files. From the Files section, browse the extractedumqttsubfolder on your Laptop/PC. Right click onumqtt→Upload to →Raspberry Pi Pico. - Save these scripts mentioned below one by one from the programming section onto the flash memory of Raspberry Pi Pico W. Launch Thonny IDE, Files →Save as →Raspberry Pi Pico :
- PiicoDev_ENS160.py. (Note: Make sure to set the I2C address for the Gravity Air Quality Sensor in line 14 of PiicoDev_ENS160.py as shown below)
_I2C_ADDRESS = 0x52 # Set the I2C address for the Gravity Air Quality Sensor
- PiicoDev_Unified.py. (Note: Make sure that the scl and sda pin values of Raspberry Pi Pico W mentioned in the circuit diagram match in line 61 of PiicoDev_Unified.py as shown below.)
elif bus is None and sda is None and scl is None: self.i2c = I2C(1, scl=Pin(27), sda=Pin(26), freq=freq) # Initialize I2C communication for Raspbrry Pi Pico W - main.py
- PiicoDev_ENS160.py. (Note: Make sure to set the I2C address for the Gravity Air Quality Sensor in line 14 of PiicoDev_ENS160.py as shown below)
- (or )Download the entire project bundle from here→IoT_based_Indoor_Air_Quality_ENS160_Monitor. Open Thonny IDE→View→✔Files. From the Files section, browse the extracted
IoT_based_Indoor_Air_Quality_ENS160_Monitorfolder on your Laptop/PC. Right click onIoT_based_Indoor_Air_Quality_ENS160_Monitor→Upload to→Raspberry Pi Pico.
- Install the
- Testing your Wi-Fi router compatibility with Raspberry Pi Pico W:-
- The Raspberry Pi Pico W supports only a 2.4 GHz network band. Ensure that the Wi-Fi router is operating in dual-band mode and supports both 2.4 GHz and 5 GHz. Otherwise, if your router is set to use only 5 GHz, the Raspberry Pi Pico W won’t be able to connect to it.
- If the signal strength is weak, try moving the Raspberry Pi Pico W closer to the Wi-Fi router or use a Wi-Fi extender to improve the signal strength.
- Check the router’s settings to make sure it’s not blocking the Raspberry Pi Pico W.
- Update the correct SSID and Password credentials of your Wi-Fi router in lines 24,25 of the main.py
- Adafruit.IO dashboard setup:
- Visit https://io.adafruit.com/ and sign up for free. Click on the key icon and make a note of your user and key credentials. Update the correct user and key in lines 30,31 of the main.py.
- Using the account you just created, go to Feeds and click on →New Feed. Name it as “temp”→Create. Do the same and create 3 other feeds, namely aqi, tvoc and eco2.
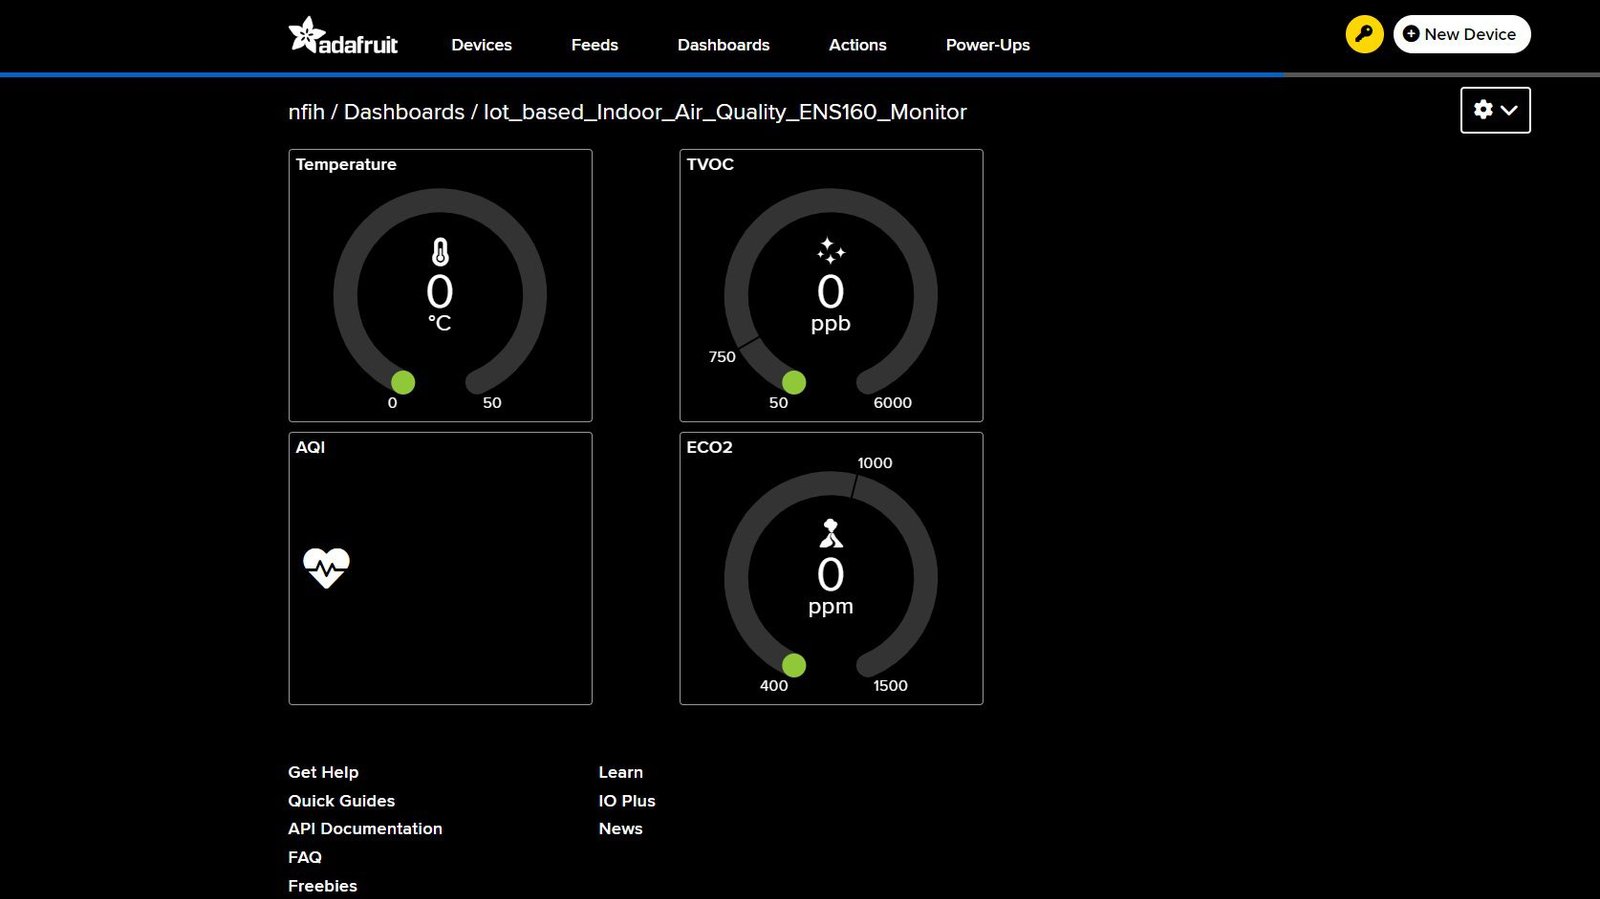
- Go to Dashboard→New Dashboard→Create. Name it as “IoT based Indoor Air Quality ENS160 Monitor”.
- Click on the ⚙ cog icon→Add block→guage→In Connect Feeds dialogue box, select ✔temp→Create block. Repeat the same for creating tvoc and eco2 blocks.
- Click on the ⚙ cog icon→Add block→text→In Connect Feeds dialogue box, select ✔aqi→Create block.
- Drag and drop the Temperature, AQI, TVOC and ECO2 blocks on your dashboard as you like. Your dashboard should look like this:
- Executing the main.py script:
- Follow all the guidelines mentioned in the steps above.
- Make hardware connections as per the above circuit and schematic diagrams.
- Switch On your Wi-Fi router.
- Log in to your Adafruit.IO account, and navigate to the “IoT based Indoor Air QualityENS160 Monitor” dashboard.
- Launch Thonny IDE, select main.py in the prompt editor and click on →Run.
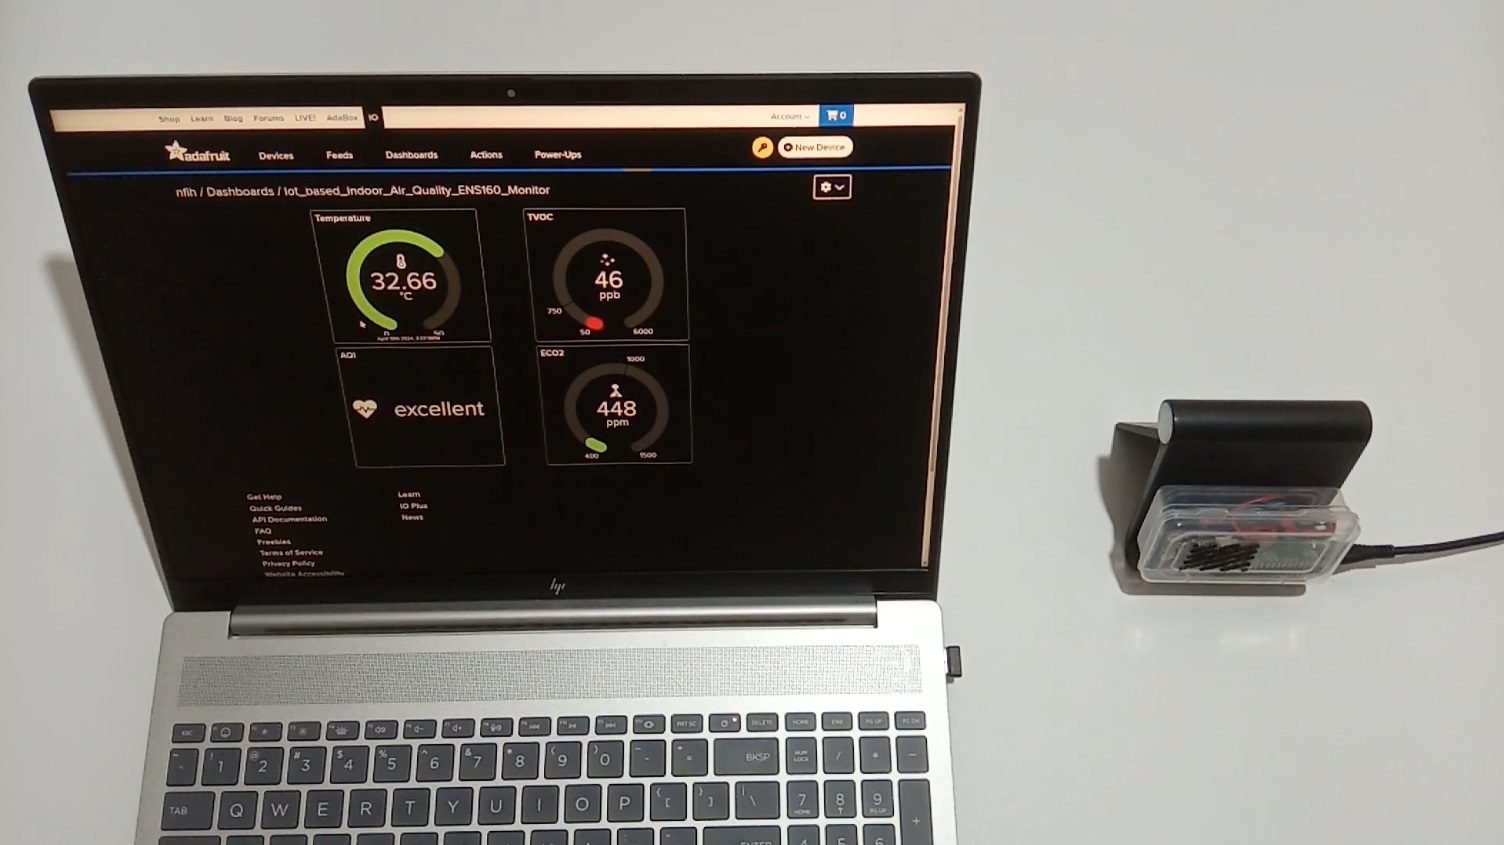
- After completing the program upload, you can plug off the USB data cable connected from Raspberry Pi Pico W to the Laptop/PC and reconnect it from Raspberry Pi Pico W to the Power bank.
- Additionally, you can use a small, clear box to store your IoT based Indoor Air Quality ENS160 Monitor. Make insertions for creating air vents and attaching the power cable.
- It’s time to test the “IoT based Indoor Air Quality ENS160 Monitor” with common household items like an incense cone or a perfume and check the LIVE air quality metrics!
PROGRAMMING
Script 1: main.py
'''
 IoT_based_Indoor_Air_Quality_ENS160_Monitor
 Made by wiztaqnia.com
 Modified date: 20/11/2024
 Typical pin layout used:
 ------------------------------------------------
 Signal           Gravity ENS160     Raspberry
                  Air Quality           Pi
                    Sensor            Pico W
 ------------------------------------------------
 3.3V                   +             3V3
 GND(Ground)            -             GND
 C(I2C clock line)      C             GP27_A1
 D(I2C data line)       D             GP26_A0
 '''
from machine import Pin, I2C, ADC
from PiicoDev_ENS160 import PiicoDev_ENS160
from PiicoDev_Unified import sleep_ms
from umqtt.simple import MQTTClient
import network
import utime

# WiFi credentials
WIFI_SSID = "your SSID"
WIFI_PASSWORD = "your password"

# Adafruit IO account credentials
AIO_SERVER = "io.adafruit.com"
AIO_PORT = 1883
AIO_USER = "your user name"
AIO_KEY = "your key"
AIO_CLIENT_ID = " Iot_based_Indoor_Air_Quality_ENS160_Monitor" # Name the client ID with anything of your choice
AIO_TOPIC_TEMP = "{}/feeds/temp".format(AIO_USER)    # Set topic for "temp" feed
AIO_TOPIC_AQI = "{}/feeds/aqi".format(AIO_USER)      # Set topic for "aqi" feed
AIO_TOPIC_TVOC = "{}/feeds/tvoc".format(AIO_USER)    # Set topic for "tvoc" feed
AIO_TOPIC_ECO2 = "{}/feeds/eco2".format(AIO_USER)    # Set topic for "eco2" feed

def connect_to_wifi(ssid, password):
    wlan = network.WLAN(network.STA_IF)
    wlan.active(True)
    wlan.connect(ssid, password)
    while not wlan.isconnected():
        pass
    print('Connected to WiFi')

# Initialise I2C Communication
i2c = I2C(1, scl=Pin(27), sda=Pin(26), freq=400000)

# Initialise the Gravity ENS160 Air Quality Sensor
monitor = PiicoDev_ENS160()

# Initialize Raspberry Pi Pico W's inbuilt temperature sensor
inbuilt_temp = ADC(4)
conversion_factor = 3.3 / (65535)

# Connect to WiFi network
connect_to_wifi(WIFI_SSID, WIFI_PASSWORD)

# Connect to Adafruit IO
client = MQTTClient(AIO_CLIENT_ID, AIO_SERVER, AIO_PORT, AIO_USER, AIO_KEY)
client.connect()

while True:
    # Read from the Gravity ENS160 Air Quality Sensor
    aqi = monitor.aqi
    tvoc = monitor.tvoc
    eco2 = monitor.eco2

    # Read the temperature
    reading = inbuilt_temp.read_u16() * conversion_factor
    temperature = 27 - (reading - 0.706)/0.001721

    # Publish air quality metrics to Adafruit IO
    client.publish(AIO_TOPIC_TEMP, "{}".format(temperature))      # publish the temperature to the "temp" feed
    client.publish(AIO_TOPIC_AQI, "{}".format(aqi.rating))        # publish the AQI rating to the "aqi" feed
    client.publish(AIO_TOPIC_TVOC, "{} ppb".format(tvoc))         # publish the TVOC value to the "tvoc" feed
    client.publish(AIO_TOPIC_ECO2, "{} ppm".format(eco2.value))   # publish the ECO2 value to the "eco2" feed

    sleep_ms(10000) #Add a time delay enough to update data in real time and avoid Data Throttle Warning.

    '''Note:- Adafruit.IO free accounts have a limit of 30 data points per minute.
    If you’re publishing data every 3 seconds, that’s 20 data points per minute for each feed.
    If you have more than one feed, you’ll quickly exceed this limit.
    To avoid this, you can increase the delay between data publications'''
OUTPUT
This post was inspired by PiicoDev Air Quality Sensor | Guide For Raspberry Pi Pico
References:
- Gravity: ENS160 Air Quality Multi-Gas Sensor Wiki – DFRobot
- Getting Started with MQTT on Raspberry Pi Pico W – Connect to the Internet of Things! – Tutorial Australia (core-electronics.com.au)
- micropython-umqtt.simple does not install · Issue #2524 · thonny/thonny · GitHub
- Raspberry Pi Pico using onboard Temperature Sensor (halvorsen.blog)

Follow her socials: Linkedin | Instagram | GitHub
- Explore Electronic Design Simulators with Arduino MAX7219 Heart Match Game - January 26, 2026
- Word Clock using MAX7219 LED Dot Matrix Display - November 23, 2025
- The Future of Quantum Computing: What Will We Choose to Do? - September 27, 2025